Usage and Credit Analytics
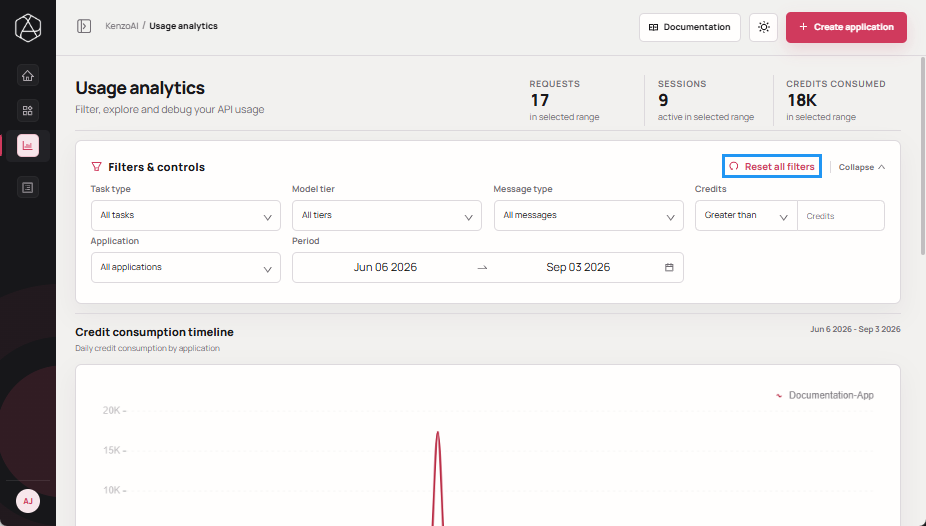
Usage analytics provides a centralized view of credit consumption across your account, helping administrators and account owners analyze usage patterns and manage credit allocation. It allows you to:
- Monitor overall credit usage at the account level.
- Analyze consumption over defined time periods and identify increases or decreases in usage.
- View detailed request logs to investigate individual requests and their associated credit consumption.
This information helps inform decisions about credit allocation, application limits, and capacity planning.
Usage Summary
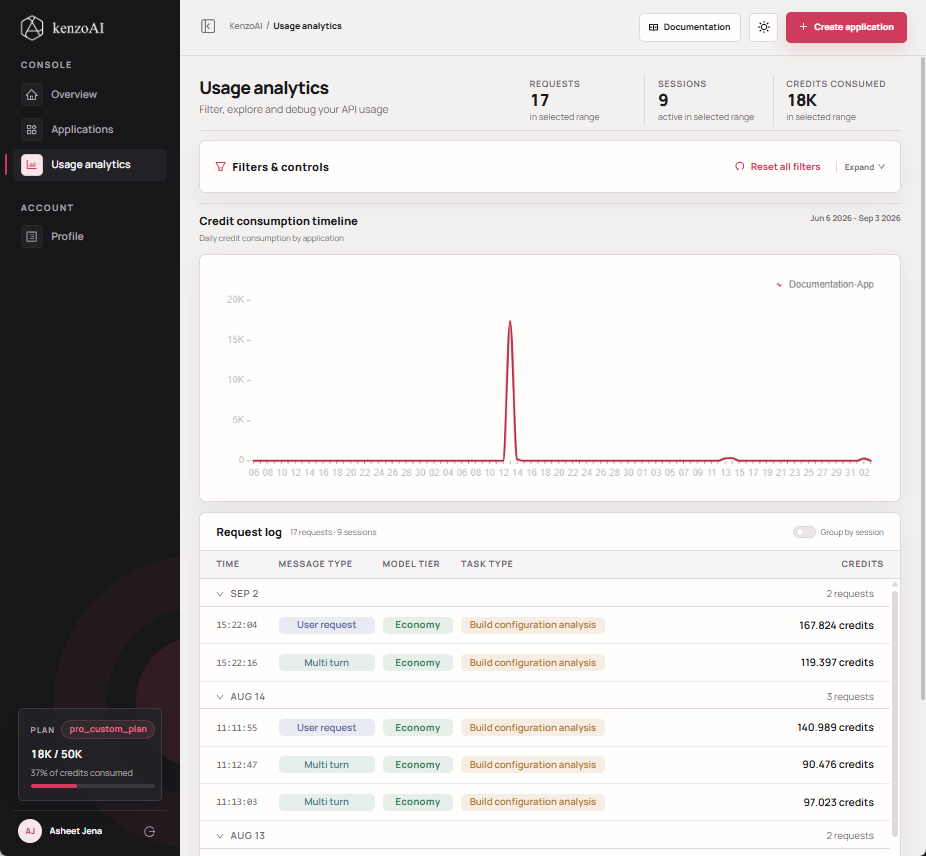
Usage Summary provides a high-level overview of usage for the selected time range. It includes the following metrics:
- Requests: The total number of API requests recorded during the selected period.
- Sessions: The total number of interaction sessions recorded during the selected period. A session can contain a single request or multiple related requests made as part of the same interaction.
- Credits Consumed: The total number of credits consumed during the selected period.
The displayed values are automatically updated based on the selected time range.
Credit Consumption Timeline
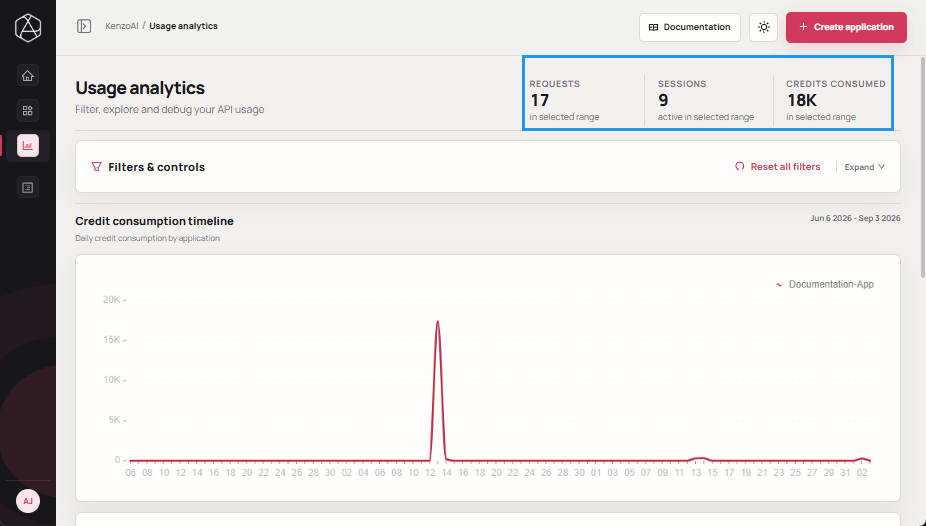
Credit consumption timeline visualizes how credits are used over a selected time range. This timeline helps you:
- Track credit usage over time using daily or aggregated intervals.
- Identify spikes, anomalies, or sustained changes in consumption.
- Correlate usage patterns with application activity or integrations.
Request Log
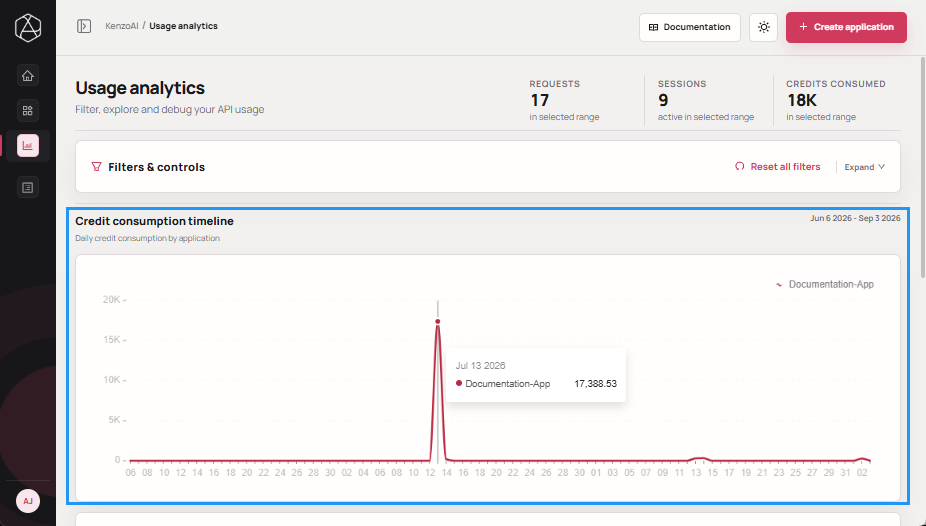
Request log provides detailed information about API requests recorded during the selected period, including the timestamp, interaction type, model tier, task type, and credits consumed.
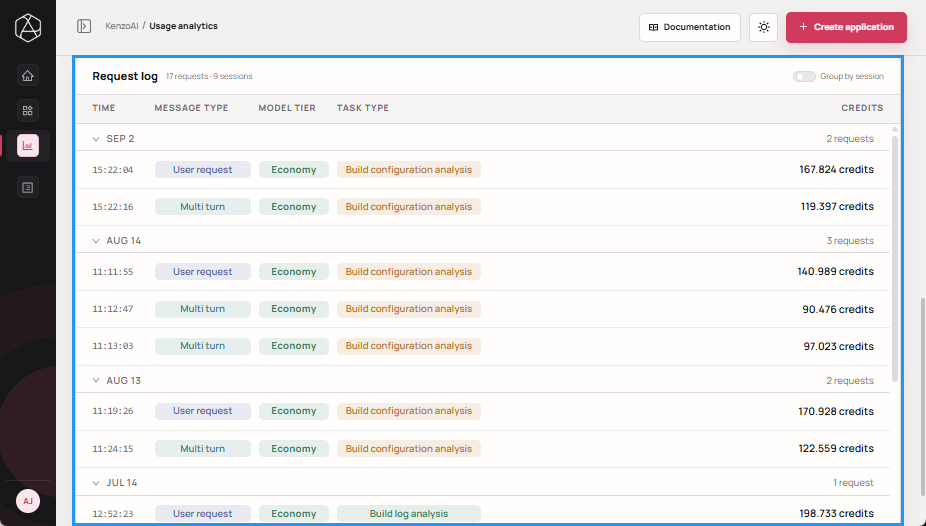
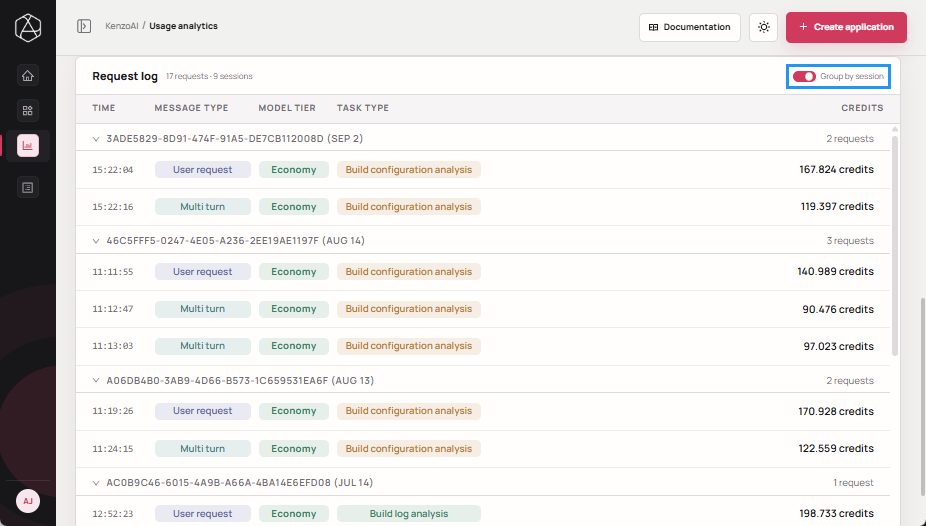
Use the Group by session toggle to group related requests into sessions, making it easier to review individual interactions and their follow-up requests.
Filter Usage Data
Use Filters & controls to narrow usage data and focus on specific usage patterns or requests. You can filter usage data by:
- Task type: Filter usage by capability.
- All tasks: Includes usage across all task types.
- Build log analysis: Analyzes build logs to identify issues and their root causes.
- Build configuration analysis: Explains and summarizes build configurations.
- Build failure analysis: Predicts build failures and assesses associated risks.
- Model tier: Filter usage by the model tier used.
- All tiers: Includes usage across all model tiers.
- Economy: Designed for lightweight analysis and cost efficiency.
- Optimized: Balances performance and cost for standard workloads.
- Best: Provides advanced reasoning and higher accuracy for complex analysis.
- Message type: Filter usage by interaction type.
- All messages: Includes all message types.
- User request: Credits consumed from direct user-initiated actions.
- Tool use response: Credits consumed from tool-driven operations.
- Multi-turn: Credits consumed during multi-step or conversational interactions.
- Credits: Filter requests by the number of credits consumed.
- Greater than: More than the specified number of credits.
- At least: The specified number of credits or more.
- Less than: Fewer than the specified number of credits.
- At most: The specified number of credits or fewer.
- Equal to: Exactly the specified number of credits.
- Application: Filter usage for a specific kenzoAI application or all applications.
- Period: Filter usage within a defined time range.
Using these filters, you can compare usage patterns, investigate anomalies, and analyze credit consumption across applications and workloads.
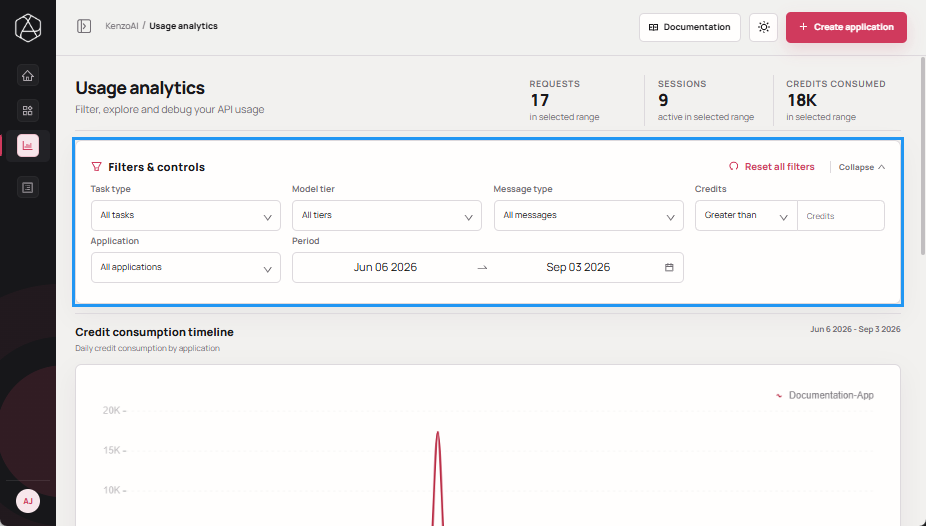
Use Reset all filters button to clear all applied filters and restore the default view.